- WE’RE HERE TO HELP 24/7
- 800.586.5555
Which Types of Vehicles Got into the Most Accidents in 2020?

Five Ways to Prevent Pool Injuries in Florida
July 16, 2021
Kanner & Pintaluga Adds Controller, Bolsters Administrative Leadership
July 19, 2021Which Types of Vehicles Got into the Most Accidents in 2020?

Does the type of vehicle you drive increase your chance of causing an accident? Maybe, but it’s usually hard to tell. For example, when a Porsche is involved in a fatal accident, the Porsche driver’s errors is a factor in about 72 percent of those accidents. However, there are a lot of potential factors at play in fatality accidents.
Determining the root cause for accident propensity statistics is a tough question to answer. It’s possible that people who are attracted to certain types of vehicles are more aggressive drivers who like to go fast and push the limits. Defensive drivers may gravitate towards other, safer vehicles in general.
However, some of the stats don’t seem to indicate those propensities. In fact, many of the cars most frequently driven by people who have a history of causing accidents are considered relatively safe vehicles.
The Cars Accident-Prone Drivers Own
These stats from Insurify aren’t a list of vehicles with the most accidents, but instead are based on the owners of cars with at least one prior at-fault accident on their record. The idea is drivers who have caused crashes before are more likely to cause accidents in the future. There may be something to the idea that certain types of vehicles appeal more to drivers who are prone to accidents.
- Hyundai Veloster (24.3 percent)
- Mazda3 (24.37 percent)
- Jeep Wrangler Unlimited (24.46 percent)
- Honda HR-V (24.57 percent)
- Toyota Prius C (24.65 percent)
- Subaru Impreza (25.2 percent)
- Hyundai Elantra GT (25.36 percent)
- Subaru WRX (25.82 percent)
- Subaru Crosstrek (25.88 percent)
- Inifiti Q50 (26.25 percent)
The national average for car owners with a previous at-fault accident is just 17.81 percent.
Is there anything about these vehicles that would particularly appeal to aggressive drivers? For the most part they are normal sedans, compact cars and crossover SUVs. There are a few sport compact cars on the list that seem like vehicles that would appeal to potentially aggressive drivers (like the Subaru WRX), but for the most part there’s no defining features that connect all those vehicles.
Absent from the list are domestic manufacturers like Ford and Chevy. Subaru has three vehicles on the list and Hyundai has two. Surprisingly, Insurify’s list seems relatively random and mundane.
Most of the vehicles on the list have a “Good” Insurance Institute for Highway Safety (IIHS) Overall Safety rating. The two exceptions are the Jeep Wrangler Unlimited with a Marginal rating and the Toyota Prius C with an Average rating.
Safest and Least Safe Vehicles for Car Crashes
Driver propensity for causing accidents and vehicle safety are two very different things. The list of vehicles that are most frequently involved in serious injury or fatality accidents is significantly different from the previous list.
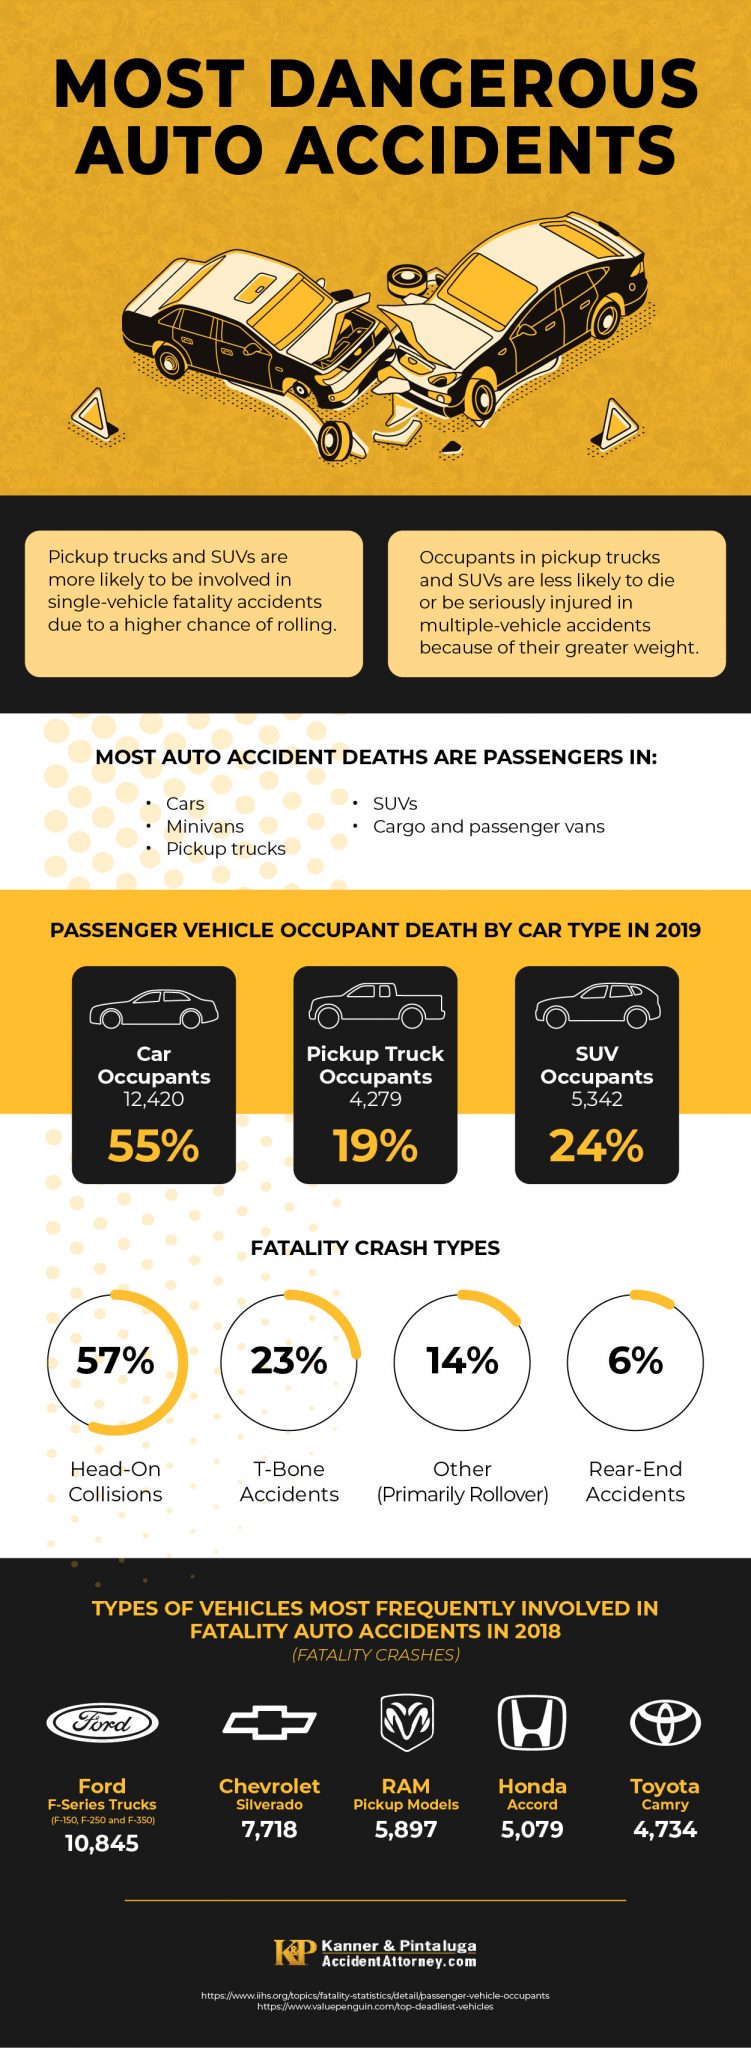
The Ford F-Series – which includes the F-150, F-250 and F-350 – was involved in the most fatality accidents during a recent National Highway Traffic and Safety data gathering period. F-Series trucks were involved in 10,845 fatality crashes during that particular study period in 2018.
Another truck, the Chevrolet Silverado, came in second at 7,718 crashes that resulted in at least one fatality.
The first car on the list and third overall was the Honda Accord. It came in far behind the other two at 5,079 fatality crashes. The Honda Accord also has the misfortune of being dangerous for passengers.
The average for passenger deaths in the 20 most dangerous vehicles is 0.59 per fatality accident, while the occupant death rate for the Honda Accord was 0.70. Only one car – the Ford Mustang – had a higher occupant death rate at 0.71 per fatality accident.
Toyota Camry came in fourth with 4,734 fatality crashes in 2018. All Ram Pickup models combined came in fifth at 5,897 fatality crashes. It was ranked below the Honda Accord and Toyota Camry on Value Penguin’s dangerous vehicles list because the occupant death rate was significantly lower at just 0.43 occupants per fatality accident.
It’s worth noting that pickup trucks occupy three of the top five spots on Value Penguin’s list. It’s well established that commercial truck accidents are particularly dangerous crashes. Semi-trucks and big rigs weigh significantly more than the average commuter vehicle and can cause grievous damage in accidents with smaller cars.
The same phenomenon has a similar effect with consumer trucks and smaller work trucks. Pickup trucks may be lighter than semi-trucks, but they’re still quite a bit bigger and heavier than compact cars, subcompact cars and even sedans and SUVs.
Age Matters
Other interesting stats highlighted by Value Penguin’s analysis are the model years of the vehicles most frequently involved in fatality accidents. The vehicles most often involved in fatality accidents in 2018 were roughly 2003 to 2008 models.
There are still many of those vehicles on the road today, but they often weren’t manufactured with backup cameras, collision avoidance technology or other safety features that are now standard in newer vehicles. The lower accident rate for newer vehicles is likely a combination of both safety features and the fact that there are just fewer brand-new vehicles on the road.

